#30 How to read a factsheet?
Before you invest in an ETF (Exchange Traded Fund), you should not only take a close look at the costs, but also at the specific characteristics of the ETF. The factsheet is a valuable source of information. But how do you read a factsheet correctly? In this podcast, we take you step by step through the most important elements of an ETF factsheet so that you can make informed investment decisions.
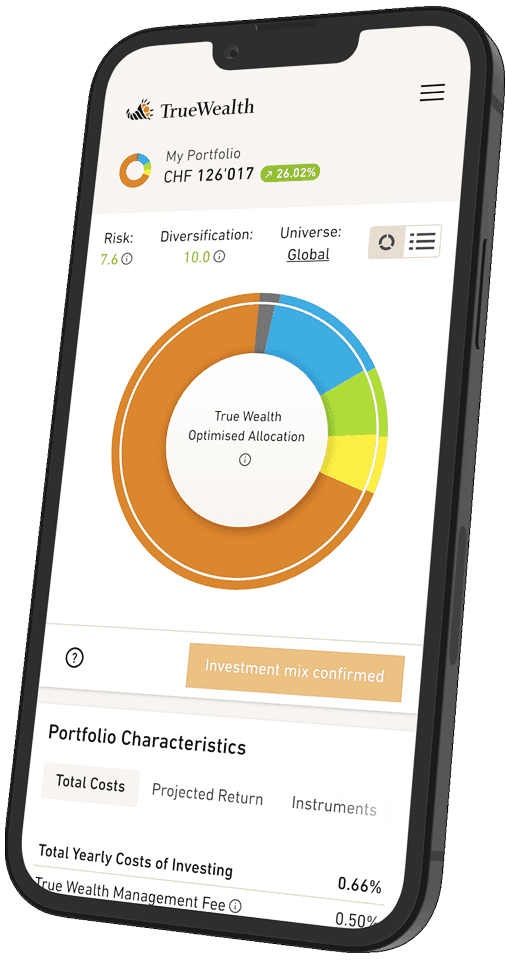
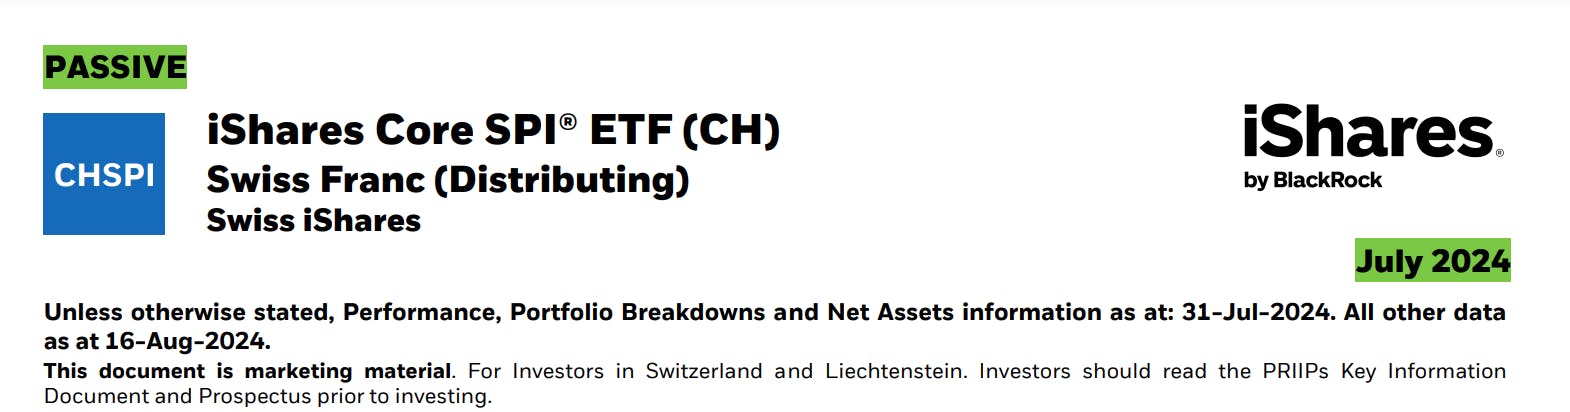
The factsheet is a compact source of information that is updated monthly. As an example, let's take a look at the factsheet of an ETF that tracks the SPI, i.e. the Swiss Performance Index (iShare Core SPI). This index is made up of roughly the 200 largest stocks traded on the Swiss Stock Exchange.
At the top of the document you will find basic information about the ETF, such as the name of the fund, the issuer (e.g. iShares from BlackRock), and the index being tracked, e.g. the Swiss Performance Index (SPI) in our example. Here you can also see the date of the factsheet, which shows you when the data was last updated.
Product information and key data
The next section lists the most important details of the ETF.
Each security has a unique ISIN number (International Securities Identification Number), which applies internationally and is used with the exception of ETFs from the USA and Canada. The first two letters of the ISIN indicate the domicile of the fund. CH is known to stand for Switzerland.
Other important details are the launch date and the fund volume. The launch date indicates how long the ETF has been in existence, while the fund volume provides information on the assets invested in the fund. Young ETFs with a low volume run the risk of being liquidated if they are not successful on the market. Larger funds, on the other hand, are more likely to survive in the long term.
The total expense ratio (TER) is one of the most important key figures on the factsheet, as it summarizes all the costs that the asset manager retains for managing the ETF. These costs are periodically deducted from the fund volume. It is worth comparing the TER between different providers in order to find the most cost-effective option.
The factsheet also provides information on the ETF's appropriation of profits. Accumulating ETFs reinvest dividend and interest income directly, while distributing ETFs pay out this income to investors. Which type is right for you depends on your personal preferences and objectives.
And finally, the methodology: this indicates which replication method the ETF uses to replicate the index. If the ETF holds the securities of the index on a one-to-one basis, this is referred to as full replication. However, full replication does not always make economic sense. If the index is replicated with a reduced selection of securities, this is referred to as sampling.
Portfolio characteristics
In the portfolio characteristics section you will find details such as the dividend yield (Yield), the price/earnings ratio (P/E), the price/book ratio (P/B) and the beta of the ETF.
The price/earnings ratio (P/E ratio) puts the company's expected profits in relation to the share price. The same applies to the price-to-book ratio (P/B ratio).
The beta is a measure of the tendency of a security to move with the overall market. A beta of 1 means that the price of the security statistically moves with the market. A beta of less than 1 means that the security tends to move less with the market, while a beta of more than 1 means that the security tends to move disproportionately with the market. An ETF should track the index it is tracking with a beta of 1 if possible.
And finally, the number of positions: This tells you how many shares or individual positions are contained in the ETF.
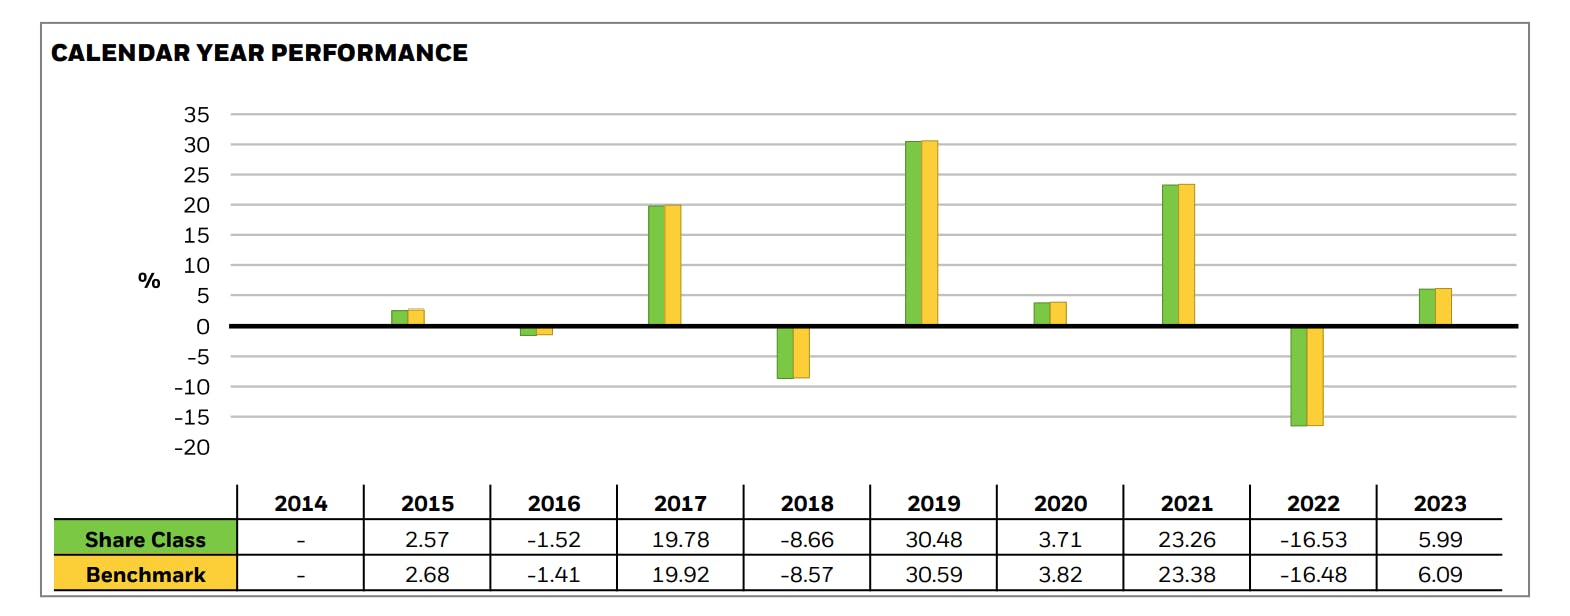
Performance of the ETF
In addition to the most important features, the factsheet also shows the performance of over the last few years. Also in direct comparison with the underlying index. But please note: The current benchmark of the ETF does not necessarily have to be the benchmark that the ETF has tracked in the past.
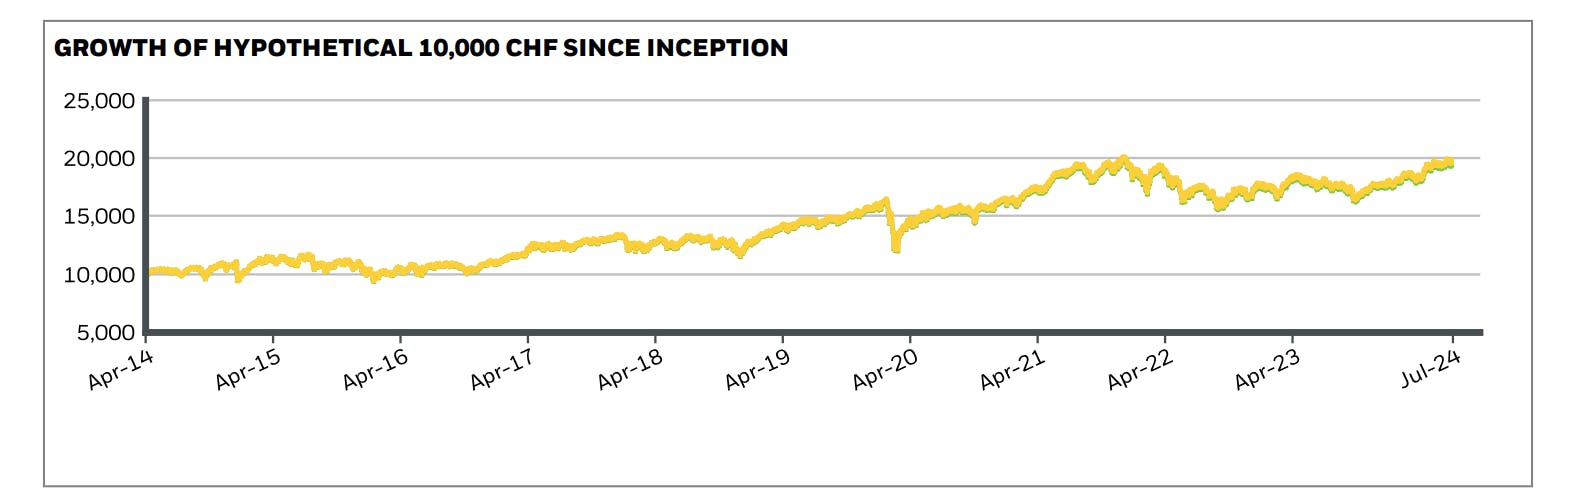
This factsheet also shows a chart that illustrates how a theoretical investment of CHF 10'000 would have developed since the ETF was launched. In our example, with an initial investment of CHF 10'000 since April 2014, we would have around CHF 18'000 today, i.e. 10 years later.
Trading information
You will find trading information at the bottom of the factsheet. Here you can see all the stock exchanges on which the ETF is listed. However, not all details are included in the factsheet. For example, you will often only find information on additional income from securities lending on the provider's website.
An ETF factsheet provides you with a comprehensive overview of the most important features and key figures of an ETF. So take the time to look at this information carefully before making an investment decision. At True Wealth you will find the factsheets of all ETFs and index funds linked directly in your dashboard.
Have you ever looked at the factsheet of an ETF? Leave us your feedback via e-mail.
About the author

Founder and CEO of True Wealth. After graduating from the Swiss Federal Institute of Technology (ETH) as a physicist, Felix first spent several years in Swiss industry and then four years with a major reinsurance company in portfolio management and risk modeling.
Ready to invest?
Open accountNot sure how to start? Open a test account and upgrade to a full account later.
Open test account